Profile
Legal Structure
Ibrahim
Fibres Limited ('IFL' or 'the Company'), established as a Public Limited
Company in 1986, is listed on the Pakistan Stock Exchange (PSX). As of the end
of January 2025, the Company's free float stands at approximately 5.0%. The
registered office of the Company is located at Ibrahim Centre, 1-Ahmed Block,
New Garden Town, Lahore - 54600, Pakistan.
Background
Incorporated
in 1986, Ibrahim Fibres Limited (IFL) is a publicly listed company on the
Pakistan Stock Exchange (PSX) and a market leader in Polyester Staple Fiber
(PSF) with a 73% market share. Over the years, the company expanded its
operations by establishing additional spinning mills and a power generation
company, which were later merged into a single entity, Ibrahim Fibres Limited,
in 2000. IFL operates one of Pakistan’s largest integrated polyester production
facilities, with a diversified portfolio spanning polyester fiber, textile
yarn, and power generation. The company’s strategic focus on vertical
integration, operational efficiency, and innovation has driven its long-term
growth and industry leadership. With state-of-the-art manufacturing, a strong
distribution network, and sustainable business practices, IFL remains a key
player in Pakistan’s textile value chain, catering to domestic and
international markets.
Operations
Ibrahim
Fibres Limited specializes in the production and marketing of Polyester Staple
Fibre (PSF) and blended yarns. The Company’s manufacturing facilities are
strategically located in Shahkot, near Faisalabad. As of the latest available
data, Ibrahim Fibres has a total polyester production capacity of approximately
390,600 tons per annum (TPA), while its spinning operations comprise around
240,192 spindles.
Ownership
Ownership Structure
The
Ibrahim Group maintains a majority ownership stake of approximately 91.80% in
Ibrahim Fibres Limited, primarily through its holding company, Ibrahim Holdings
(Private) Limited.
Stability
The
Ibrahim Group strategically established Ibrahim Holdings (Pvt.) Limited to
oversee succession planning and optimize investment management across its
subsidiary and associated companies, including Allied Bank Limited. This
structured approach enhances corporate governance, ensuring financial stability
and long-term sustainability for Ibrahim Fibres Limited.
Business Acumen
The sponsors of
Ibrahim Fibres Limited possess over five decades of extensive experience in the
textile industry, complemented by professional expertise in banking, finance,
and the power sector. This diverse industry exposure strengthens the Company’s
strategic decision-making and operational resilience.
Financial Strength
The
Ibrahim Group maintains a robust financial position, with a strong net worth
underpinning its business operations. The sponsors have consistently
demonstrated both the willingness and capacity to support Ibrahim Fibres
Limited, as evidenced by past financial assistance, including an interest-free
loan to sustain operations. Additionally, the group holds a majority stake of
approximately 90% in Allied Bank Limited, further reinforcing its financial
strength and strategic influence in the banking sector.
Governance
Board Structure
Ibrahim
Fibres Limited is governed by a seven-member Board of Directors, led by
Chairman Mr. Sheikh Mukhtar Ahmad. The board structure comprises four
representatives from the Ibrahim Group, ensuring strategic alignment with the
majority shareholders, alongside two independent directors who contribute to
enhanced corporate governance, oversight, and regulatory compliance.
Members’ Profile
Mr.
Sheikh Mukhtar Ahmad, Chairman of both Ibrahim Fibres Limited and the Ibrahim
Group, brings over 63 years of extensive experience in founding and
successfully managing various industrial and financial enterprises. In addition
to his leadership at Ibrahim Fibres, he serves on the boards of other group
companies, contributing to strategic decision-making across the organization.
The Board of Directors collectively possesses substantial industry expertise
and diversified professional experience, with long-standing tenures that
reinforce stability and continuity in the Company’s governance.
Board Effectiveness
To
ensure robust oversight, three key committees—Audit, Human Resources, and
Nomination—are actively engaged in governance matters. Member participation in
meetings remains consistently strong, reflecting a commitment to effective
decision-making. Additionally, the Board facilitates a Directors’ Training
Program throughout the year, designed to enhance the expertise and strategic
acumen of its members, thereby enabling them to fulfill their responsibilities
with greater proficiency and impact.
Financial Transparency
The
external auditors of the Company, M/s. Yousuf Adil – Chartered Accountants,
have issued an unqualified audit opinion on the financial statements for the
period ending December 31st, 2023. Furthermore, it is noteworthy that the
Company has transitioned its financial reporting period from a fiscal year to a
calendar year. The audit for the calendar year 2024 (CY24) is currently in
progress and will be finalized in due course.
Management
Organizational Structure
Ibrahim
Fibres operates with a well-defined, functionally departmentalized
organizational structure, meticulously segmented into distinct units, including
polyester production facilities, spinning plants, and power generation plants.
Management Team
Mr. Mohammad Naeem Mukhtar serves as the Chief Executive Officer (CEO) of Ibrahim Fibres
Limited, bringing over 38 years of in-depth experience in finance, industrial
manufacturing, and corporate leadership. In addition to his role at Ibrahim
Fibres, Mr. Mukhtar is the CEO of Ibrahim Holdings (Pvt.) Limited and holds directorial
positions in several other companies within the Ibrahim Group, contributing his
expertise in strategic oversight and organizational growth. Mr. Mohammad Naeem Asghar,
the Chief Financial Officer (CFO) of Ibrahim Fibres, has been a key figure in
the company for the past 34 years, with 12 years of dedicated service as CFO.
His extensive experience in financial management, coupled with his deep
understanding of the company’s operations, has been instrumental in navigating
the financial complexities of the business. The senior management team at
Ibrahim Fibres is distinguished by its long-standing tenure and proven track
record, reflecting a profound commitment to the company’s success and sustained
growth. Their collective expertise and leadership have played a critical role
in the company’s industry leadership and strategic direction.
Effectiveness
Senior
management conducts meetings on an ad-hoc basis, strategically convening to
deliberate on key matters and drive informed decision-making processes.
MIS
The company has implemented robust and seamlessly integrated systems, adopting Oracle as its enterprise resource planning (ERP) solution. This strategic integration enhances operational efficiency, ensures data accuracy, and facilitates real-time decision-making. By leveraging Oracle’s advanced capabilities, the company generates comprehensive, insightful, and data-driven MIS reports, empowering management with valuable analytics for informed strategic planning and performance optimization.
Control Environment
Ibrahim
Fibres maintains a dedicated internal audit function to ensure objective
oversight and accountability. The Company also boasts a highly skilled quality
control department, further supported by its ISO 9002 certification,
demonstrating its commitment to maintaining the highest standards of quality.
Business Risk
Industry Dynamics
As of 2023, global polyester fiber production reached
approximately 71.1 million metric tons, representing 57% of total global fiber
output. This reflects a steady increase from ~63 million metric tons in 2022,
when polyester accounted for 54% of total fiber production, reinforcing its
position as the dominant fiber in the global textile industry. Global demand
for Polyester Staple Fiber (PSF) is expected to remain favorable, with market
projections estimating the PSF sector's size to reach USD 3,024.3 million by
2026. The primary raw materials for PSF, namely Pure Terephthalic Acid (PTA)
and Mono Ethylene Glycol (MEG), are derived from crude oil, leading to price
fluctuations that contribute to the inherent price volatility of PSF.
Consequently, profit margins are heavily influenced by international price
trends and exchange rate fluctuations. Notably, over 80% of global PSF
production is concentrated in China, India, and Southeast Asia, regions that
are also the primary exporters of the product. In CY23, polyester fiber
production contracted by approximately 5.0%, driven by subdued demand and a
broader economic deceleration. In contrast, imports of polyester fiber
experienced a notable year-on-year (YoY) increase of around 10%. Local sales in
CY24 totaled 343,127 tons, reflecting a decline of approximately 10.8% compared
to 384,673 tons in CY23. This decrease is attributed to the ongoing challenges
in domestic production amid the prevailing market conditions.
Relative Position
Pakistan’s
Polyester Staple Fiber (PSF) industry is primarily dominated by three key
players: Ibrahim Fibres Limited (IFL), Lucky Core Industries Limited, and
Rupali Polyester. Among these, Ibrahim Fibres holds the largest market share at 73%, solidifying its position as the industry leader. Lucky Core Industries
Limited follows with a 24% market share, while Rupali Polyester accounts for 3%.
IFL’s market dominance is driven by its large-scale production capacity,
advanced manufacturing technology, and vertically integrated operations,
allowing it to achieve cost efficiencies and supply chain stability. The
company’s extensive customer base, strong distribution network, and focus on
quality standards further reinforce its competitive edge. In contrast, competitors
operate on a smaller scale, with relatively limited market penetration.
With
polyester continuing to be the most widely used synthetic fiber, IFL remains
well-positioned to capitalize on future growth opportunities, benefiting from
its strong industry presence, financial resilience, and strategic expansion
plans.
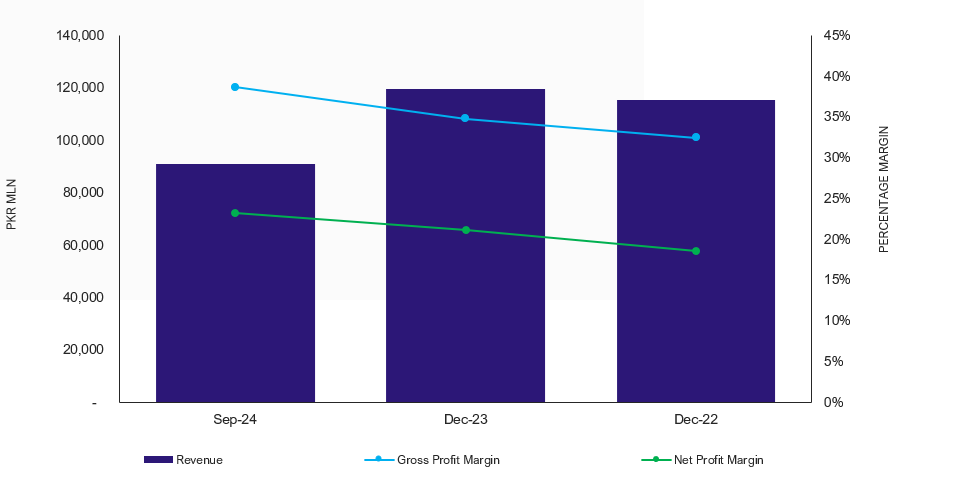
Revenues
Ibrahim
Fibres Limited (IFL) maintains a stable revenue profile, with the Polyester
Staple Fiber (PSF) segment contributing 64% of total sales in CY24, while the
spinning segment accounts for 36%. For 9MCY24, net sales stood at PKR 91.04
billion, reflecting a 1.4% growth over CY23 (PKR 119.76 billion). During
9MCY24, Polyester sales reached 156,355 tons (PKR 57.17 billion), while Textile
sales totaled 43,650 tons (PKR 33.85 billion). IFL’s diversified revenue mix,
operational efficiency, and strategic pricing approach support its resilience
and stable performance amid evolving industry conditions.
Margins
During
9MCY24, the Company's gross margins exhibited a slight improvement, reaching
approximately 7.7% (CY23: ~7.5%). Meanwhile, operating margins remained stable
at around 5% in both 9MCY24 and CY23. Notably, the net profit margin
strengthened to ~1.9% in 9MCY24 (CY23: ~0.3%), primarily driven by exchange
rate stability and reduction in borrowing cost.
Sustainability
Ibrahim
Fibres Limited remains a financially robust and strategically agile entity,
well-equipped to sustain long-term growth. While expansion plans are currently
on hold pending industry stabilization, the Company’s strong forecasting and budgeting
framework provides a solid foundation for navigating economic uncertainties.
Additionally, IFL benefits from a well-diversified product portfolio,
encompassing Polyester Staple Fiber (PSF), spinning, and power generation
segments, which collectively enhance revenue stability and mitigate
sector-specific risks. By maintaining a data-driven and risk-mitigated
approach, IFL is well-positioned to uphold its market leadership and long-term
business viability while capitalizing on evolving industry dynamics.
Financial Risk
Working capital
The
Company’s working capital requirements are primarily driven by inventory
procurement of key raw materials, including Pure Terephthalic Acid (PTA), Mono
Ethylene Glycol (MEG), cotton, and viscose, which are financed through a
combination of internal cash generation and short-term borrowings. The Company
maintains a historically efficient net working capital cycle with minimal
receivables exposure. During 9MCY24, the net working capital cycle improved,
with working capital days decreasing to 76 days (CY23: 82 days). This
improvement is primarily attributable to optimized inventory management,
efficient procurement strategies, and stable supply chain dynamics, allowing
the Company to maintain leaner inventory levels without disrupting production.
The continued focus on working capital efficiency enhances liquidity, reduces
reliance on short-term financing, and strengthens overall financial resilience.
Coverages
During
9MCY24, the Company’s Free Cash Flow from Operations (FCFO) stood at PKR 6,220
million (CY23: PKR 7,589 million), reflecting an increase attributed to changes
in working capital and operating cash flows. The interest coverage ratio also
improved, reaching 5.7x (CY23: 5.1x), demonstrating an enhanced capacity to
cover interest expenses with operating income. The core coverage ratio remained
stable at 3.1x (CY23: 3.1x), indicating consistent financial performance in
relation to its core obligations and operational efficiency.
Capitalization
IFL’s capital
structure is characterized by a low leverage profile, with short-term debt
accounting for 58.7% of the total debt book in 9MCY24. During CY23, the Company
maintained a leverage ratio of 21.4%, with short-term borrowings comprising
over 65% of the total debt. However, in 9MCY24, the proportion of short-term
debt decreased to 58.7%, and the leverage ratio improved to 16.4%. This
reduction in short-term borrowings reflects the Company’s strategic focus on
debt management and improving its debt maturity profile, which enhances
financial stability and reduces refinancing risk.
|