Rating History
Dissemination Date Long-Term Rating Short-Term Rating Outlook Action Rating Watch
18-Mar-25 A- A2 Stable Maintain -
18-Mar-24 A- A2 Stable Upgrade -
22-Mar-23 BBB+ A2 Stable Upgrade -
15-Sep-22 BBB A2 Stable Maintain -
15-Sep-21 BBB A2 Stable Initial -
About the Entity

MMC is an unlisted public company. It is a J.V between Chunxing RRC (45.82% shareholding), MIJ (18.67%), and Mr. Babar Waheed Malik-CEO and board chairman holds 17.75%. Mr. Saeed Rafiq holds 17.75%. MMC board consists of four non-executives and one executive director.

Rating Rationale

Malik MIJ Chunxing Resources Recycling Co. Limited (MMC or "the Company") is a leading player in Pakistan’s lead smelting and recycling sector. The Company specializes in recycling Used Lead Acid Batteries (ULAB) and refining lead bullion. Committed to sustainable practices, MMC provides comprehensive solutions for the efficient utilization of ULAB across Pakistan, with a goal of producing 99.994% refined “Green Lead.” The Company’s total production capacity stands at 50,000 tons per annum, encompassing both smelting and refining operations. MMC benefits from a strong ownership structure, operating as a strategic joint venture among leading global players. This includes Jiangsu Chunxing Resources Recycling Company, one of China’s largest lead recyclers with over four decades of experience in secondary lead production and recycling, and MIJ International, a UAE-based global metals trader. Additionally, local industry players with extensive market experience contribute to MMC’s strategic advantage. This partnership grants MMC access to advanced recycling technologies and a diverse global clientele. Pakistan’s lead recycling industry remains fragmented, with MMC facing competition from a large, unorganized sector. The demand for recycled lead is closely tied to energy deficits and trends in the auto sector. In FY24, lead-acid battery production volume experienced a slight year-over-year decline due to reduced demand stemming from the economic slowdown. However, in the first half of FY25, demand rebounded as macroeconomic conditions stabilized, driven by the growing adoption of solar energy solutions and a recovery in the automobile sector. Strategically positioned in both local and export markets, MMC leverages its partnership with MIJ, which acts as a quality guarantor (ensuring 99.994% refined lead) for international sales, primarily to Trafigura, a globally renowned commodity trader. In FY24, MMC's revenue grew by ~24%, reaching PKR 25bln, with exports contributing 35.6% in total sales. The revenue increase was driven by price inflation and higher sales volumes, leading to improved profitability margins at all levels. Looking ahead, MMC plans to expand its production capacity over the next three years. Additionally, it has diversified its product portfolio by becoming the only local producer of Calcium Alloy and Antimony Alloy, key materials used in battery terminals and maintenance-free batteries. MMC’s board primarily serves an advisory role, with members bringing extensive industry-specific expertise and technical knowledge. The Company maintains an adequate financial risk profile, supported by strong cash flows, working capital cycles, and financial coverage ratios. Its capital structure remains leveraged, with short-term borrowings primarily used for working capital needs while maintaining a moderate equity base.

Key Rating Drivers

The ratings depend on upholding sustainable profits while retaining sufficient cash flows and coverages. The company needs to enhance its governance framework and the efficacy of the financial transparency. Furthermore, adherence to maintaining its debt metrics at an adequate level is a prerequisite.

Profile
Legal Structure

Malik MIJ Chunxing Resources Recycling Co. Limited (MMC or 'the Company') is a public unlisted company. The registered office of the Company is situated at Building # 08-CCA1, 3rd Floor, Street # 23, Phase 6, DHA, Lahore, Pakistan, and its plant is located at Faisalabad Industrial City Plot No. 50, Sahianwala Interchange, District Faisalabad, Punjab.


Background

The company was incorporated in Pakistan on August 05, 2014, as a private limited company under the Companies Ordinance, 1984 (Repealed with the enactment of the Companies Act, 2017 on May 30, 2017) vide the certificate of incorporation no.009145. Subsequently, it was converted into a public limited Company on July 08, 2015.


Operations

The Company is principally engaged in the business of recycling & disposal of used lead acid batteries, lead plates, lead paste, and powder as well as manufacturing and sale of bullion and refined lead. The intsalled capacity to produce refined lead is 50,000 tons per annum.


Ownership
Ownership Structure

The Company is jointly ventured by Jiangsu New Chunxing Resource Recycling Co., MIJ International, and Mr. Babar Waheed Malik. Jiangsu New Chunxing Resource Recycling Co. having 45.82% of the share, is incorporated outside Pakistan and the company's registered address is "Circular Economy Industrial Park, Pizhou, Jiangsu province, China". MIJ International is also incorporated outside Pakistan and the company's registered address is "Unit No.2609 JBC5 Plot # JLT-PH2- WIA, Jumeirah Lakes Towers, Dubai-UAE" and has 18.67% shareholding. The remaining 35.5% of the shareholding is divided equally among Mr. Babar Waheed Malik (CEO) and Mr. Saeed Rafiq


Stability

The associated company ‘Jiangsu New Chunxing Resource Recycling Co., Ltd’ has experience of 3 decades in producing and refining secondary lead. It comes under the umbrella of Jiangsu Chunxing Alloy Group Co., Ltd, a company with over 40 years of experience in processing ULAB (Used Lead Acid Battery). The other sponsor is MIJ International with a decade of experience in trading, processing, and producing ferrous and non-ferrous metals.


Business Acumen

The sponsors of the Company have substantial experience in global metal trading and the recycling & disposal of used lead acid batteries, lead plates, lead paste, and lead powder industry. 


Financial Strength

Jiangsu New Chunxing Resource Recycling Co., Ltd is a top-ranked recycling company in China with over 40 years of experience in processing ULAB (Used Lead Acid Battery). The present ULAB treatment capacity is 1 million MT/annum and the secondary lead output capacity is 600,000 MT/annum. MIJ International is a Dubai-based metal merchant specializing in trading, processing, and production of ferrous and non-ferrous metals. MMC has an equity base of PKR 4.5bln as of Dec-24.


Governance
Board Structure

The Company’s board consists of five members, including four non-executive directors. Mr. Babar Waheed serves as the chairman of the board. Board meetings are held as needed, and no committees have been formed. Additionally, there is no formal policy for recording board minutes. Voluntary compliance with the Code of Corporate Governance could provide additional benefits.


Members’ Profile

Mr. Babar Waheed is the Company's Chairman and a seasoned business professional with extensive entrepreneurial experience in both UAE and Pakistan. All other members are well qualified with considerable Lead recycling business experience and a diversified skill mix.


Board Effectiveness

MIJ board is more of an advisory nature as all members on average possess 30 years of experience. The board has no formal committees but all members are involved in and ensure their input in the decision-making process.


Financial Transparency

Hassan Farooq & Co., Chartered Accountants are the external auditors of the Company. The firm is QCR-rated. They gave an unqualified opinion on the company’s financial statements for the year ended June 30, 2024. To futher enhance the transparency, it is recommended that MMC should consider to engage external auditors which belongs to the State Bank of Pakistan (SBP) category.


Management
Organizational Structure

The Company has an adequate Organizational structure. The departments are mainly divided into two categories under the umbrella of CEO; (I) Accounts, Tax & Finance department supervised by Mr. Haider Abbas (CFO) & (II) Production and Operations managed by Mr. GUO (GM Operations).


Management Team

Mr. Babar Waheed (CEO) leads the management team. He has been associated with the lead business for the last 27 years and has played a key role in the success of the Company. Mr. Haider Abbas is the CFO he is a fellow member of association of certified chartered accountants and posseses ample industry and professional experience.


Effectiveness

The Company has no management committees in place. However, senior management members meet on a daily basis to discuss ongoing issues and plans.


MIS

The Company has implemented two software, one is SQL web-based and the other one is Chinese software, convertible into two languages at a time.


Control Environment

The management has a strong control environment within the Company supplemented by a robust quality control system for its production processes. Additionally, the Company has technical collaboration agreements with international firms to ensure that quality standards are adhered to.


Business Risk
Industry Dynamics

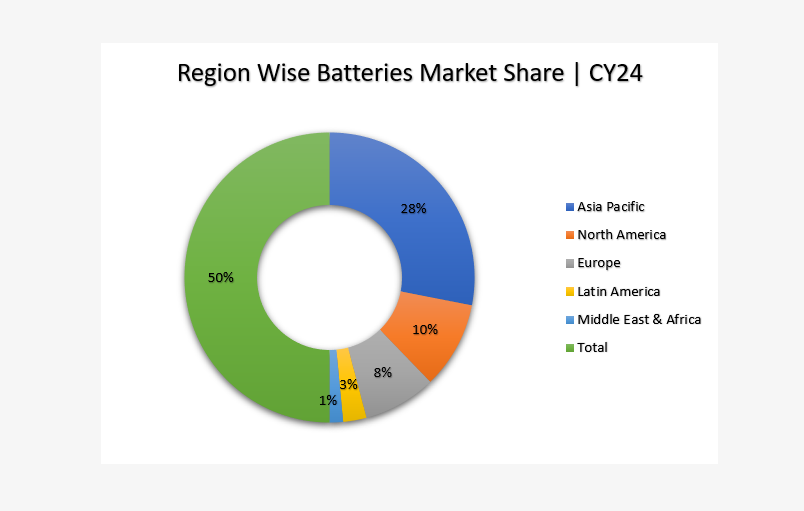
During CY24, the global batteries sector was valued at USD~146.2bln (CY23: USD~125.4bln), a YoY increase of ~16.5%. In terms of regions, the Asia Pacific batteries sector reached to USD~82.3bln in CY24 (CY23: USD~70.4bln), a YoY increase of ~16.9%. Asia Pacific region contributed ~56.1% to the global batteries market share during CY24. In terms of industries, the automotive industry accounted for the majority share of the batteries sector during CY24. The anticipated rise in the demand for lithium-ion batteries in the end-use segment for passenger cars is expected to be supported by rising awareness about the benefits offered by electric vehicles operating in regions like Asia Pacific, Europe, and North America. The global batteries sector is expected to reach to USD~680.9bln by CY34. The growth rate of the market is expected to increase over the forecast period, owing to increased demand for Electric Vehicles (EVs). The rapid growth of the EV market represents an important driver for expanding the global batteries sector. EVs are vehicles that run on electric motors, meaning they use batteries to store and supply energy for propulsion. As of Dec’24, prices stood at USD 1,985/MT, with a further decline expected amid rising supply and weak Chinese demand.The demand for local recycled lead is closely tied to energy deficits and trends in the auto sector. In FY24, lead-acid battery production volume experienced a slight year-over-year decline due to reduced demand stemming from the economic slowdown. However, in the first half of FY25, demand rebounded as macroeconomic conditions stabilized, driven by the growing adoption of solar energy solutions and a recovery in the automobile sector. 


Chart 1: Global Market Share
Relative Position

The organized lead smelting segment is dominated by MMC, other players includes International Metal Industries (Pvt.) Ltd, Metpak Industries (Pvt.) Ltd. 


Revenues

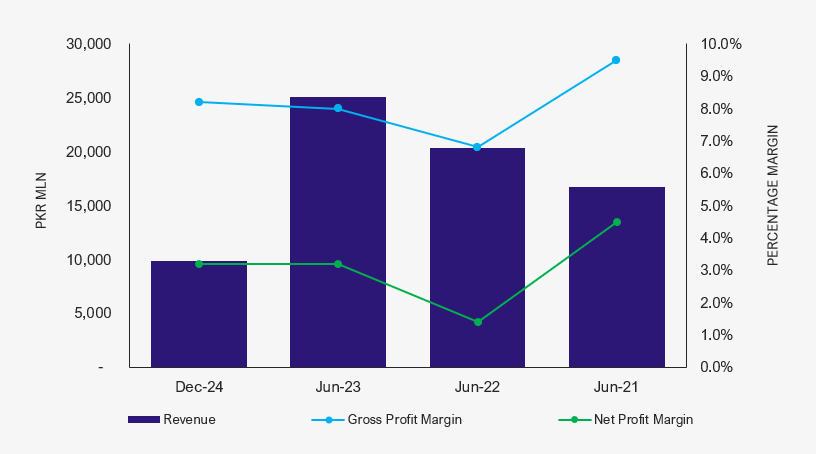
During FY24, the topline of the Company recorded at ~PKR 25bln (FY:23 ~ PKR 20.3bln) reflecting an increase of ~26%. This increase was primamrily attributed to price inflation and improved prodcution volumes. Capacity utilization was reached at ~74% in FY24 (FY23: 69%). During 6MFY25, the revenue stood at PKR 9,864 mln, reflecting a decline of ~21.4% YoY (FY24: PKR 25,098 mln). The drop was primarily due to lower sales volume due to cylicality effect as in winters demand and sale of lead acid battery remains at lower side. Exports contributed ~36% of total revenue, providing a hedge against inflation and exchange rate fluctuations.


Graph 1: Profitability Matrix
Margins

The Company's gross margin improved to 8.2% in 6MFY25 (FY24: 8.0%, FY23: 6.8%), driven by better cost efficiencies. Meanwhile, the net margin stood at 3.2% (FY24: 3.2%, FY23: 1.4%). Net profit reached PKR 320mln in 6MFY25 (FY24: PKR 808 million, FY23: PKR 289 million), benefiting from price adjustments and currency stabilization, leading to foreign exchange gains.


Sustainability

The company has a strong clientele in Pakistan as well as a wide network of resources and clientage through its associated companies' strong positions in leading markets all around the world. Moving forward MMC also has an expansion plan to enhance its capacities from 50,000MT to 75,000 over the period of three years. The management has a proper budgeting and forecasting function in place, and it was observed that the Company's performance was aligned with the forcasted financial projections.


Financial Risk
Working capital

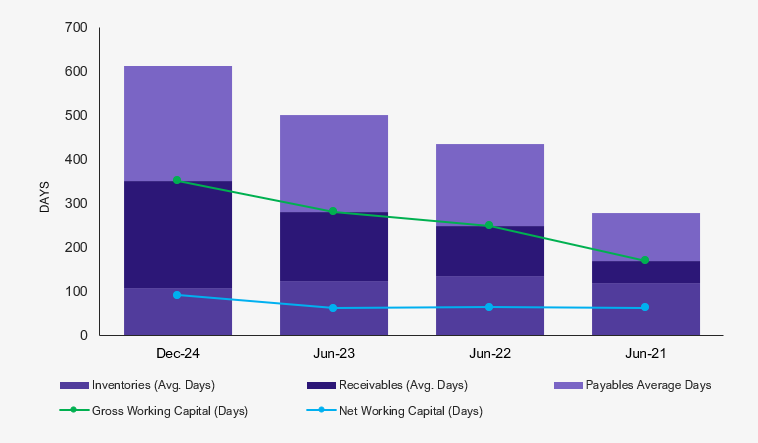
During 6MFY25, inventory days stood at 108 days, reflecting an improvement from 124 days in FY24 and 135 days in FY23. Trade receivable days increased to 245 days (FY24: 158 days, FY23: 115 days), leading to a gross working capital cycle of 353 days (FY24: 282 days, FY23: 250 days). Net working capital days stood at 92 days, indicating a stretched working capital cycle. The short-term trade leverage stood at 17.1%, providing adequate room for further borrowing.


Graph 2: Working Capital Cycle
Coverages

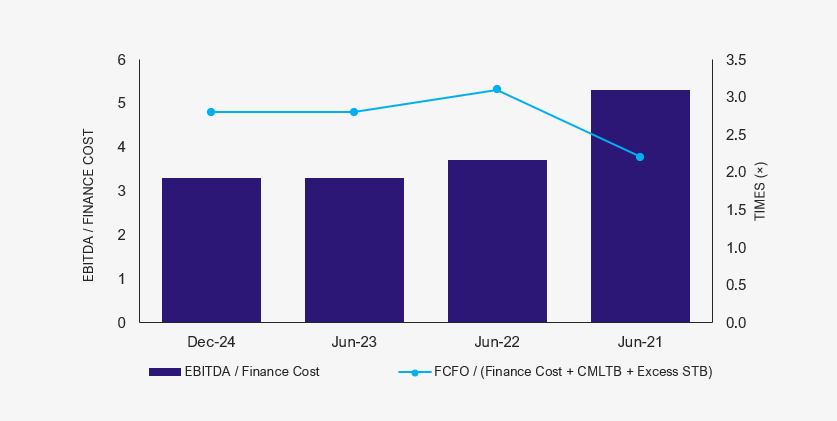
he Company generated FCFO of PKR 627 million in 6MFY25 (FY24: PKR 1,474 million, FY23: PKR 1,368 million). However, the interest coverage ratio declined to 3.3x (FY24: 3.3x, FY23: 3.7x), reflecting higher finance costs. Similarly, the debt coverage ratio stood at 2.8x (FY24: 2.8x, FY23: 3.1x), while the debt payback ratio remained stable at 0.0x.


Graph 3: Financial Coverages
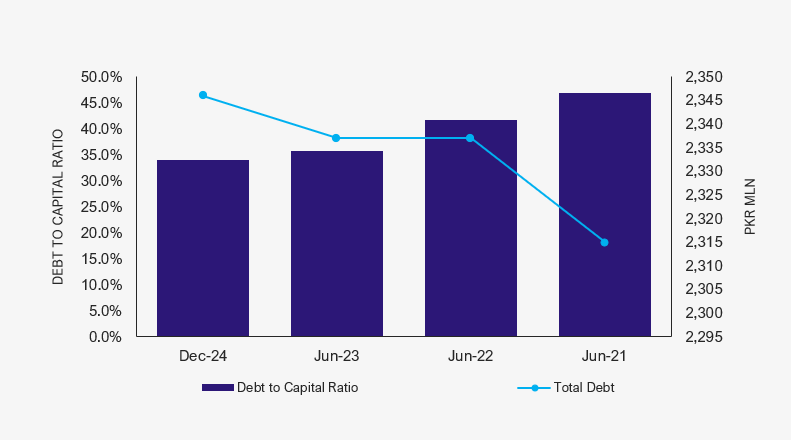
Capitalization

The Company maintains a leveraged capital structure, with a total borrowings-to-equity ratio of 34.0% in 6MFY25 (FY24: 35.6%, FY23: 41.7%), improving due to higher net equity from retained earnings. Short-term borrowings accounted for ~99.5% of total borrowings, standing at PKR 2,335 million in 6MFY25.


Graph 4: Capital Structure


Mar-25

www.pacra.com


Dec-24
6M
Jun-24
12M
Jun-23
12M
Jun-22
12M
A. BALANCE SHEET
1. Non-Current Assets 1,552 1,655 1,676 1,520
2. Investments 0 0 0 0
3. Related Party Exposure 0 0 0 0
4. Current Assets 17,386 21,844 18,069 10,906
a. Inventories 2,783 8,861 8,241 6,821
b. Trade Receivables 13,935 12,554 9,132 3,646
5. Total Assets 18,938 23,499 19,745 12,426
6. Current Liabilities 12,045 16,937 13,821 7,194
a. Trade Payables 11,726 16,494 13,598 7,034
7. Borrowings 2,346 2,337 2,337 2,315
8. Related Party Exposure 0 0 134 134
9. Non-Current Liabilities 0 0 0 0
10. Net Assets 4,547 4,225 3,453 2,782
11. Shareholders' Equity 4,547 4,225 3,453 2,782
B. INCOME STATEMENT
1. Sales 9,864 25,098 20,307 16,761
a. Cost of Good Sold (9,054) (23,096) (18,925) (15,175)
2. Gross Profit 810 2,002 1,383 1,587
a. Operating Expenses (208) (509) (296) (352)
3. Operating Profit 602 1,493 1,086 1,235
a. Non Operating Income or (Expense) (11) 195 (125) (143)
4. Profit or (Loss) before Interest and Tax 591 1,688 962 1,092
a. Total Finance Cost (240) (572) (465) (278)
b. Taxation (30) (308) (208) (60)
6. Net Income Or (Loss) 320 808 289 754
C. CASH FLOW STATEMENT
a. Free Cash Flows from Operations (FCFO) 627 1,474 1,368 1,368
b. Net Cash from Operating Activities before Working Capital Changes 373 902 938 1,098
c. Changes in Working Capital (384) (804) (647) (795)
1. Net Cash provided by Operating Activities (11) 98 291 304
2. Net Cash (Used in) or Available From Investing Activities (7) (133) (347) (22)
3. Net Cash (Used in) or Available From Financing Activities 10 (18) 21 (154)
4. Net Cash generated or (Used) during the period (8) (53) (35) 128
D. RATIO ANALYSIS
1. Performance
a. Sales Growth (for the period) -21.4% 23.6% 21.2% 92.4%
b. Gross Profit Margin 8.2% 8.0% 6.8% 9.5%
c. Net Profit Margin 3.2% 3.2% 1.4% 4.5%
d. Cash Conversion Efficiency (FCFO adjusted for Working Capital/Sales) 2.5% 2.7% 3.5% 3.4%
e. Return on Equity [ Net Profit Margin * Asset Turnover * (Total Assets/Shareholders' Equity )] 14.6% 21.1% 9.3% 31.8%
2. Working Capital Management
a. Gross Working Capital (Average Days) 353 282 250 171
b. Net Working Capital (Average Days) 92 63 65 64
c. Current Ratio (Current Assets / Current Liabilities) 1.4 1.3 1.3 1.5
3. Coverages
a. EBITDA / Finance Cost 3.3 3.3 3.7 5.3
b. FCFO / Finance Cost+CMLTB+Excess STB 2.8 2.8 3.1 2.2
c. Debt Payback (Total Borrowings+Excess STB) / (FCFO-Finance Cost) 0.0 0.0 0.1 0.4
4. Capital Structure
a. Total Borrowings / (Total Borrowings+Shareholders' Equity) 34.0% 35.6% 41.7% 46.8%
b. Interest or Markup Payable (Days) 40.6 44.0 52.2 36.9
c. Entity Average Borrowing Rate 18.4% 21.6% 18.2% 10.6%

Mar-25

www.pacra.com

Mar-25

www.pacra.com

  1. Rating Team Statements
    1. Rating is just an opinion about the creditworthiness of the entity and does not constitute a recommendation to buy, hold, or sell any security of the entity rated or to buy, hold, or sell the security rated, as the case may be. (Chapter III; 14-3-(x))
    2. Conflict of Interest
      1. The Rating Team or any of their family members have no interest in this rating (Chapter III; 12-2-(j))
      2. PACRA, the analysts involved in the rating process, and members of its rating committee and their family members do not have any conflict of interest relating to the rating done by them (Chapter III; 12-2-(e) & (k))
      3. The analyst is not a substantial shareholder of the customer being rated by PACRA [Annexure F; d-(ii)]
      4. Explanation: for the purpose of the above clause, the term "family members" shall include only those family members who are dependent on the analyst and members of the rating committee.
  2. Restrictions
    1. No director, officer, or employee of PACRA communicates the information acquired by him for use for rating purposes to any other person, except where required under law to do so. (Chapter III; 10-(5))
    2. PACRA does not disclose or discuss with outside parties or make improper use of the non-public information which has come to its knowledge during a business relationship with the customer. (Chapter III; 10-7-(d))
    3. PACRA does not make proposals or recommendations regarding the activities of rated entities that could impact a credit rating of the entity subject to rating. (Chapter III; 10-7-(k))
  3. Conduct of Business
    1. PACRA fulfills its obligations in a fair, efficient, transparent, and ethical manner and renders high standards of services in performing its functions and obligations. (Chapter III; 11-A-(a))
    2. PACRA uses due care in the preparation of this Rating Report. Our information has been obtained from sources we consider to be reliable, but its accuracy or completeness is not guaranteed. PACRA does not, in every instance, independently verify or validate information received in the rating process or in preparing this Rating Report. (Clause 11-(A)(p))
    3. PACRA prohibits its employees and analysts from soliciting money, gifts, or favors from anyone with whom PACRA conducts business. (Chapter III; 11-A-(q))
    4. PACRA ensures before the commencement of the rating process that an analyst or employee has not had a recent employment or other significant business or personal relationship with the rated entity that may cause or may be perceived as causing a conflict of interest. (Chapter III; 11-A-(r))
    5. PACRA maintains the principle of integrity in seeking rating business. (Chapter III; 11-A-(u))
    6. PACRA promptly investigates in the event of misconduct or a breach of the policies, procedures, and controls, and takes appropriate steps to rectify any weaknesses to prevent any recurrence, along with suitable punitive action against the responsible employee(s). (Chapter III; 11-B-(m))
  4. Independence & Conflict of Interest
    1. PACRA receives compensation from the entity being rated or any third party for the rating services it offers. The receipt of this compensation has no influence on PACRA’s opinions or other analytical processes. In all instances, PACRA is committed to preserving the objectivity, integrity, and independence of its ratings. Our relationship is governed by two distinct mandates: i) rating mandate - signed with the entity being rated or issuer of the debt instrument, and ii) fee mandate - signed with the payer, which can be different from the entity.
    2. PACRA does not provide consultancy/advisory services or other services to any of its customers or their associated companies and associated undertakings that are being rated or have been rated by it during the preceding three years, unless it has an adequate mechanism in place ensuring that the provision of such services does not lead to a conflict of interest situation with its rating activities. (Chapter III; 12-2-(d))
    3. PACRA discloses that no shareholder directly or indirectly holding 10% or more of the share capital of PACRA also holds directly or indirectly 10% or more of the share capital of the entity which is subject to rating or the entity which issued the instrument subject to rating by PACRA. (Chapter III; 12-2-(f))
    4. PACRA ensures that the rating assigned to an entity or instrument is not affected by the existence of a business relationship between PACRA and the entity or any other party, or the non-existence of such a relationship. (Chapter III; 12-2-(i))
    5. PACRA ensures that the analysts or any of their family members shall not buy, sell, or engage in any transaction in any security which falls in the analyst’s area of primary analytical responsibility. This clause, however, does not apply to investments in securities through collective investment schemes. (Chapter III; 12-2-(l))
    6. PACRA has established policies and procedures governing investments and trading in securities by its employees and for monitoring the same to prevent insider trading, market manipulation, or any other market abuse. (Chapter III; 11-B-(g))
  5. Monitoring and Review
    1. PACRA monitors all the outstanding ratings continuously, and any potential change therein due to any event associated with the issuer, the security arrangement, the industry, etc., is disseminated to the market immediately and in an effective manner after appropriate consultation with the entity/issuer. (Chapter III; 17-(a))
    2. PACRA reviews all the outstanding ratings periodically on an annual basis. Provided that public dissemination of annual review and in an instance of change in rating will be made. (Chapter III; 17-(b))
    3. PACRA initiates an immediate review of the outstanding rating upon becoming aware of any information that may reasonably be expected to result in downgrading of the rating. (Chapter III; 17-(c))
    4. PACRA engages with the issuer and the debt securities trustee to remain updated on all information pertaining to the rating of the entity/instrument. (Chapter III; 17-(d))
  6. Probability of Default
    1. PACRA’s Rating Scale reflects the expectation of credit risk. The highest rating has the lowest relative likelihood of default (i.e., probability). PACRA’s transition studies capture the historical performance behavior of a specific rating notch. Transition behavior of the assigned rating can be obtained from PACRA’s Transition Study available at our website. (www.pacra.com) However, the actual transition of rating may not follow the pattern observed in the past. (Chapter III; 14-3(f)(vii))
  7. Proprietary Information
    1. All information contained herein is considered proprietary by PACRA. Hence, none of the information in this document can be copied or otherwise reproduced, stored, or disseminated in whole or in part in any form or by any means whatsoever by any person without PACRA’s prior written consent.

Mar-25

www.pacra.com